What basic features does TradingView offer?
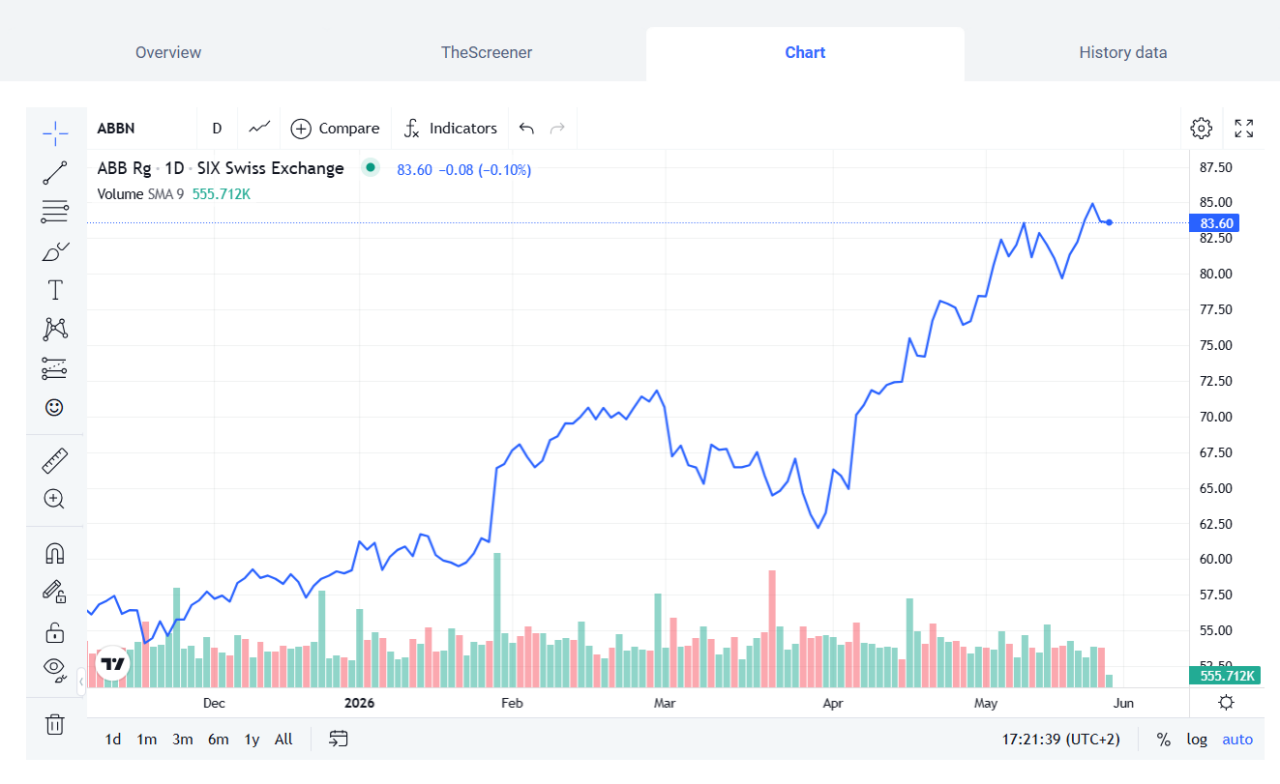
- Basic line chart
This is the simplest way to track a security’s performance.
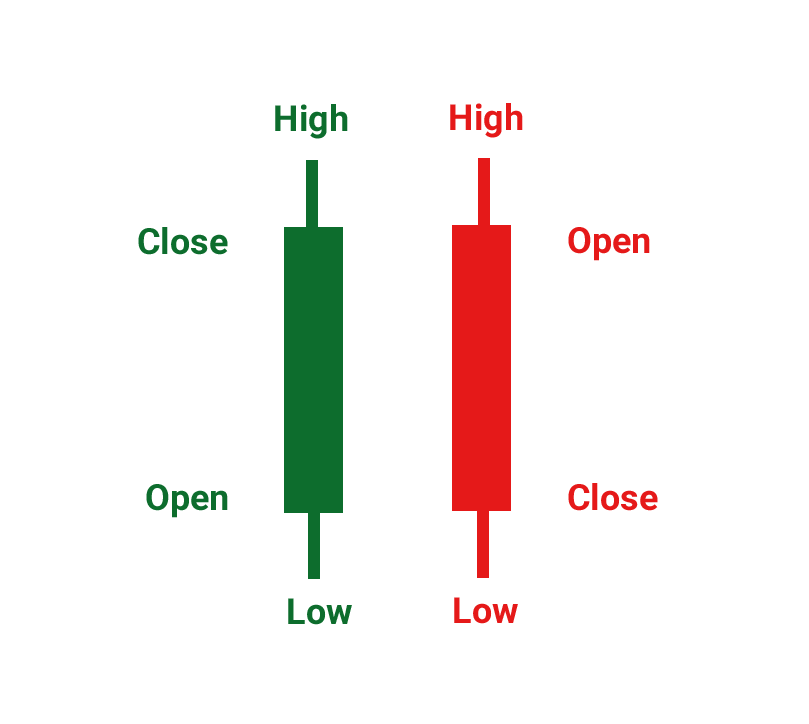
- Candlestick chart
Candlestick charts help you better understand market movements. Each candlestick shows four price points:
-the opening price,
-the closing price,
-the daily high,
-the daily low
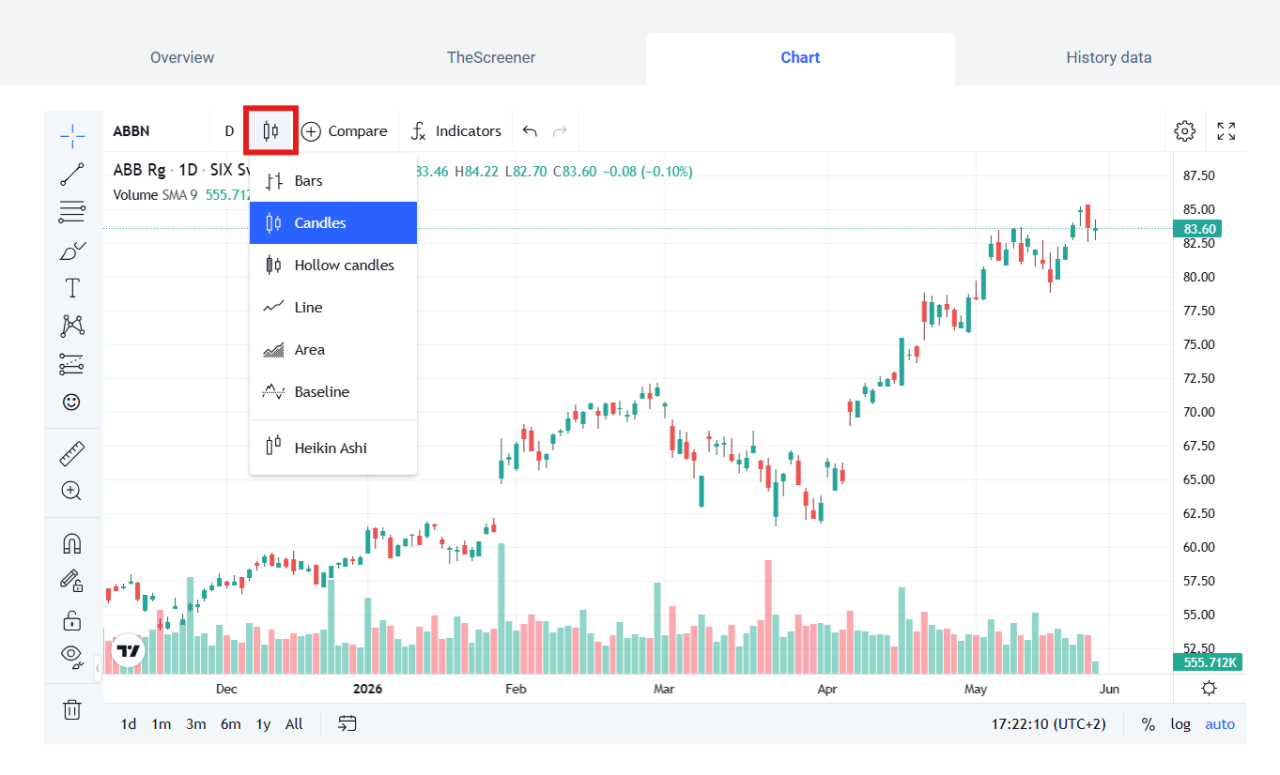
You can switch between chart views by clicking on the icon shown below, then selecting the type of chart you want (e.g., “Candlestick” or “Line”).
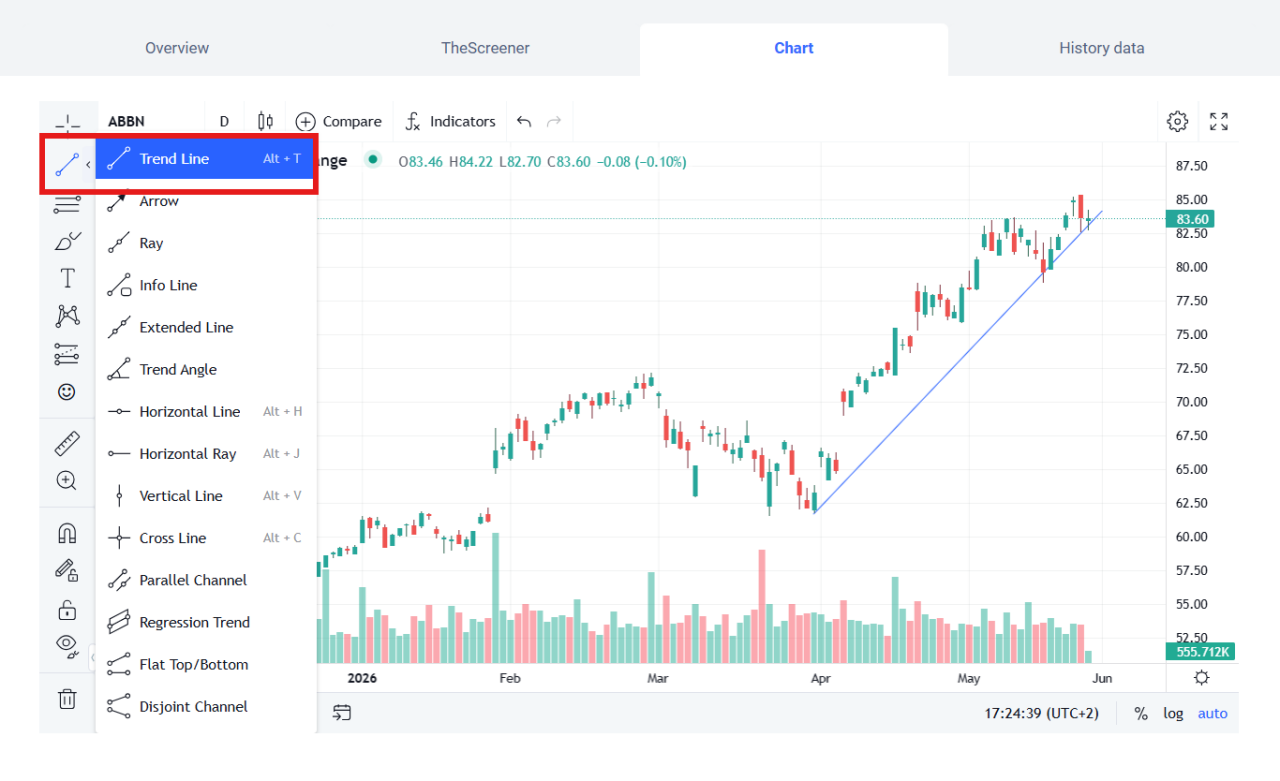
- Trendline
A trendline connects at least three pivot highs (for a downtrend) or three pivot lows (for an uptrend). A breached trendline can indicate that a trend is beginning to weaken or that it will soon end. You can draw a trendline by clicking on the line icon at the left of the chart, then selecting“Trendline.”
Need more information?
Phone

Our Customer Service Center is open Monday through Friday, 7:30am to 10pm, with some exceptions*
*e.g., days on which the markets are closed or have modified trading hours
Our Customer Service Center is open Monday through Friday, 7:30am to 10pm, with some exceptions*
*e.g., days on which the markets are closed or have modified trading hours

This service is for general questions only. We won’t be able to answer any specific questions concerning your accounts or stock exchange orders.
This service is for general questions only. We won’t be able to answer any specific questions concerning your accounts or stock exchange orders.
Secure message

For questions about your accounts and order status
For questions about your accounts. Note that we do not execute orders based on a secure message.